
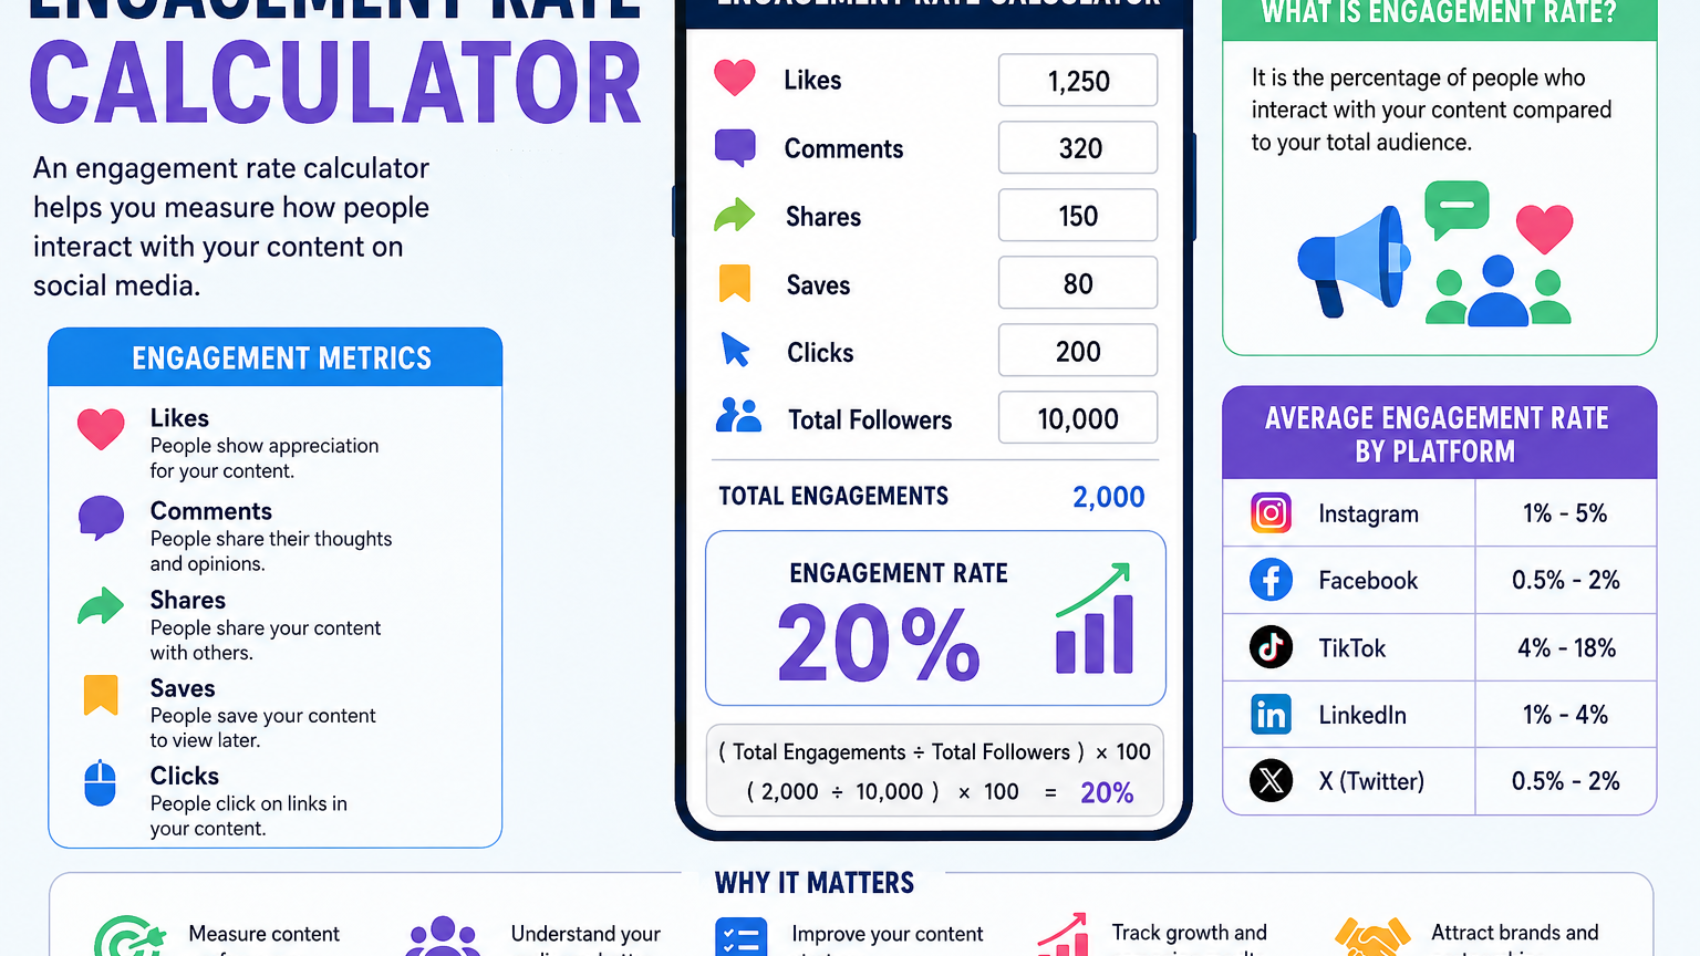
An engagement rate calculator is a tool that helps you measure how people interact with your content on social media. It shows the level of engagement based on likes, comments, shares, saves, clicks, and other actions. This metric helps creators, brands, and marketers understand audience interest.
Today, engagement matters more than follower count. A profile with fewer followers but strong interaction often performs better than a large account with low activity. Because of this, many businesses use engagement data before they start influencer campaigns.
The engagement rate calculator is one of the most useful tools for social media analysis. It helps you track content performance, compare campaigns, and improve marketing results. As a result, you can make better content decisions with clear data.
Why Engagement Rate Matters
Engagement rate shows how active your audience is. It helps you understand whether people enjoy your content or ignore it. Therefore, it is a key performance indicator for social media success.
When users like, comment, or share a post, they show interest in your content. These actions help platforms recognize valuable content. As a result, your posts can reach more people.
Brands also use engagement rates to find quality influencers. A creator with strong engagement often delivers better campaign results. Therefore, engagement data helps companies make smart marketing choices.
What Is an Engagement Rate Calculator
An engagement rate calculator is a digital tool that calculates audience interaction percentages. It uses engagement actions and audience size to generate a rate. The tool removes manual calculations and saves time. You only need a few numbers such as likes, comments, shares, followers, impressions, or reach.
Then the calculator provides a quick result. Many marketers use these calculators daily. They help evaluate campaigns, compare posts, and monitor account growth. Therefore, they are important for social media management.
How Engagement Rate Is Calculated
Most calculators use a simple formula. The basic calculation measures total interactions against audience size.
Standard Formula
| Metric | Formula |
| Engagement Rate | (Total Engagements ÷ Followers) × 100 |
| Reach Engagement Rate | (Total Engagements ÷ Reach) × 100 |
| Impression Engagement Rate | (Total Engagements ÷ Impressions) × 100 |
Total engagements usually include likes, comments, shares, saves, and clicks.
For example, if a post receives 500 engagements and the account has 10,000 followers, the engagement rate equals 5%. This number helps compare content performance across accounts.
Types of Engagement Metrics
Different platforms track different engagement actions. Therefore, marketers often use multiple metrics. Likes show quick appreciation from users. Comments show deeper interest because people spend time sharing opinions.
Shares help content reach new audiences. Saves indicate that users find content valuable and want to view it later. Together, these actions provide a complete picture of engagement.
Benefits of Using an Engagement Rate Calculator
The calculator provides fast and accurate results. Therefore, users avoid mistakes that often happen during manual calculations. It also helps compare different posts. You can identify high-performing content and learn what works best for your audience. Many businesses use engagement data for campaign reporting. As a result, they can show clear performance metrics to clients and stakeholders.
Engagement Rate by Followers
This method compares engagement against total followers. It is one of the most common approaches in social media marketing. Many influencers use this calculation because follower counts are easy to access.
Therefore, the method works well for quick performance checks. However, not every follower sees every post. Because of this, marketers sometimes use reach-based calculations for greater accuracy.
Engagement Rate by Reach
Reach-based engagement measures interactions against the number of people who actually saw the content. This method often provides a clearer view of content performance. It focuses on real viewers rather than total followers. As a result, many experts consider reach engagement one of the strongest social media metrics.
Engagement Rate by Impressions
Impressions represent the total number of times content appears on screens. Therefore, impression-based engagement tracks interaction against total views. This metric helps evaluate content visibility and audience response.
It is useful for paid advertising campaigns and sponsored posts. Marketers often compare impression engagement with reach engagement to gain deeper insights into campaign performance.
Average Engagement Rates on Social Media
Engagement benchmarks vary across platforms. Therefore, comparing your results with industry averages can help measure success.
| Platform | Average Engagement Range |
| 1% – 5% | |
| 0.5% – 2% | |
| TikTok | 4% – 18% |
| 1% – 4% | |
| X (Twitter) | 0.5% – 2% |
These values may change based on industry, audience size, and content quality.
How Influencers Use Engagement Data
Influencers use engagement metrics to understand audience behavior. They review post performance and adjust content strategies. High engagement often attracts brand partnerships. Companies prefer creators who maintain strong audience interaction. Therefore, engagement reports help influencers increase sponsorship opportunities and improve campaign results.
How Brands Evaluate Engagement
Brands review engagement before investing in marketing campaigns. They want to know whether an audience is active and responsive. Strong engagement often indicates trust and audience loyalty. Therefore, companies use this metric during influencer selection. Many marketing teams combine engagement data with reach, impressions, and conversion metrics for complete analysis.
Common Factors That Affect Engagement Rate
Content quality has a major impact on engagement. Helpful, informative, and entertaining posts often receive more interactions. Posting consistency also matters. Regular content helps maintain audience interest and visibility. Audience relevance plays an important role as well. Content that matches audience interests often generates stronger engagement.
Steps to Improve Engagement Rate
Step 1: Create Valuable Content
Focus on content that solves problems or provides useful information. People engage more with content that helps them.
Step 2: Use Strong Visuals
Images, videos, and graphics attract attention quickly. Therefore, visual content often generates higher engagement.
Step 3: Post Consistently
A consistent posting schedule helps keep your audience active and interested in your content.
Step 4: Understand Your Audience
Review analytics regularly. Then create content based on audience interests and behavior.
Step 5: Track Performance
Use analytics tools and engagement rate calculators to measure results and improve future content.
Best Uses of an Engagement Rate Calculator
The tool helps marketers monitor campaign performance. It also supports influencer analysis and content evaluation. Businesses use it for competitor research. They can compare performance levels within their industry. Content creators also use engagement tracking to identify trends and improve audience relationships.
Engagement Rate Calculator for Different Platforms
Instagram creators often focus on likes, comments, shares, and saves. TikTok users track views, shares, and comments. Facebook marketers monitor reactions, comments, and shares.
LinkedIn users focus on professional interactions and content engagement. Because every platform measures activity differently, calculators often provide platform-specific formulas and reports.
Common Mistakes When Measuring Engagement
Many users focus only on follower counts. However, follower numbers alone do not reflect audience activity. Some marketers ignore reach and impression data. This can create an incomplete view of performance.
Others compare accounts from different industries without considering audience differences. Therefore, benchmark comparisons should remain relevant to the niche.
The Future of Engagement Analytics
Social media platforms continue to improve analytics tools. As a result, engagement measurement becomes more detailed each year. Artificial intelligence helps marketers analyze audience behavior and content trends.
This creates better optimization opportunities. The best engagement rate calculator tools will continue to provide faster insights, deeper analysis, and stronger reporting features for marketers and creators.
FAQ’s
What is a good engagement rate?
A good engagement rate often falls between 1% and 5%. However, results vary by platform and industry.
Why is engagement rate important?
It measures audience interaction and helps evaluate content performance and marketing success.
Can a small account have a high engagement rate?
Yes. Small accounts often achieve strong engagement because they maintain closer audience connections.
Which engagement formula is most accurate?
Reach-based engagement is often considered more accurate because it measures interactions from actual viewers.
Who should use an engagement rate calculator?
Influencers, marketers, businesses, content creators, agencies, and social media managers can all benefit from this tool.
Conclusion
An engagement rate calculator helps measure audience interaction with speed and accuracy. It provides valuable insights into content performance across different social media platforms. Therefore, it has become an important tool for creators and marketers.
Engagement data helps identify successful content strategies. It also supports influencer marketing, campaign analysis, and audience research. As a result, businesses can make informed marketing decisions based on real performance metrics.
The engagement rate calculator remains one of the most valuable social media analysis tools available today. By tracking engagement regularly, users can improve content quality, increase audience interaction, and achieve stronger digital marketing results.
Leave Your Comment